Beginner’s Guide to Salesforce Reporting with Walkthrough Tutorial
May 15, 2025
|
5
min read

Introduction to Salesforce Reporting
Salesforce offers a wide range of tools to improve business processes. One of its most valuable features is the ability to run customized Salesforce reports. The beauty of this is that you don’t need to be a data analyst to get the insight that you need.
In this Beginner's Guide to Salesforce Reporting, we will explore the basics of creating custom reports, customizing layouts, and visualizing Salesforce data using the Salesforce Report Builder. There’s a step-by-step reporting tutorial at the end to help walk through the process, so stay tuned!
What is Salesforce Reporting?
Salesforce is one big database. Naturally, Salesforce allows users to extract and analyze this data through its powerful reporting feature. Reports present data in an organized format that’s easy to understand, enabling users to visualize trends, look for opportunities, and identify problems using interactive dashboards and charts.
Why Should Beginners Learn About Salesforce Reporting?
Whether you're an employee or a manager, learning how to create reports in Salesforce is a key skill. Success in any business requires regular reflection of activities, strategizing resources, and presenting findings to the rest of the organization.
In a world without Salesforce, this might have been done with pivot tables and graphs, which isn’t ideal for every employee. Salesforce reporting tools empower everyone to be data-driven, not just analysts.
Creating and Customizing Your First Salesforce Report
Accessing the Salesforce Report Builder
On the menu, there should be a tab labeled “Reports” for you—just like accessing Opportunities or Contacts. If this tab is not available, then you will need to ensure you’re in the correct App and have the proper permissions. If you aren’t sure, ask your Salesforce Admin for help.
Click on the “New Report” button to start building your report using the Salesforce Report Builder interface.

Choosing the Right Report Type
Before creating a report, you must select the appropriate Salesforce report type. A report type decides two things:
Which records you’d like to view in the report.
The fields to access, display, and manipulate.
Do you want to report on Opportunities? Contacts? Products tied to Opportunities? Choosing the correct Salesforce custom report type will define your entire layout.
⚠️ Note: The Report Type cannot be changed once selected!

Navigating and Customizing Reports
Exploring the Report Builder Interface
Salesforce has built an intuitive, user-friendly interface for building reports. Let’s go through some important tools:
Outline: Select fields, arrange report columns, and group your data.
Filters: Refine your dataset based on custom conditions.
Show Fields: View the list of available fields for the selected report type.
Update Preview Automatically: Toggle this to preview changes instantly.
Save & Run: This button saves the report and executes it simultaneously.

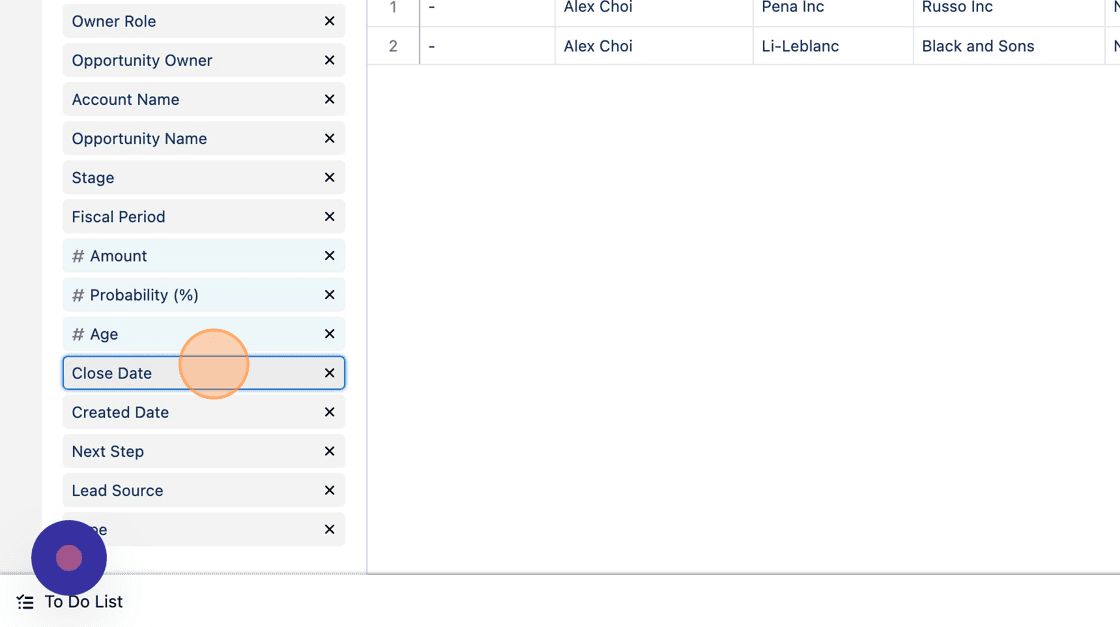
Adding and Removing Columns
In the Outline tab, add or remove fields under the Columns section. You can drag and drop to re-order them. Tailor your report to focus on the most relevant business information.
Grouping Data in Reports
Data grouping is used to categorize your results—for example, grouping Opportunity records by Stage to analyze your pipeline.
You can:
Use the Add Group search bar.
Drag from Columns into the Groups section.
Click the dropdown arrow next to a field and select "Group Rows by This Field".
Grouping is essential for visual breakdowns and is key to insightful Salesforce dashboards.

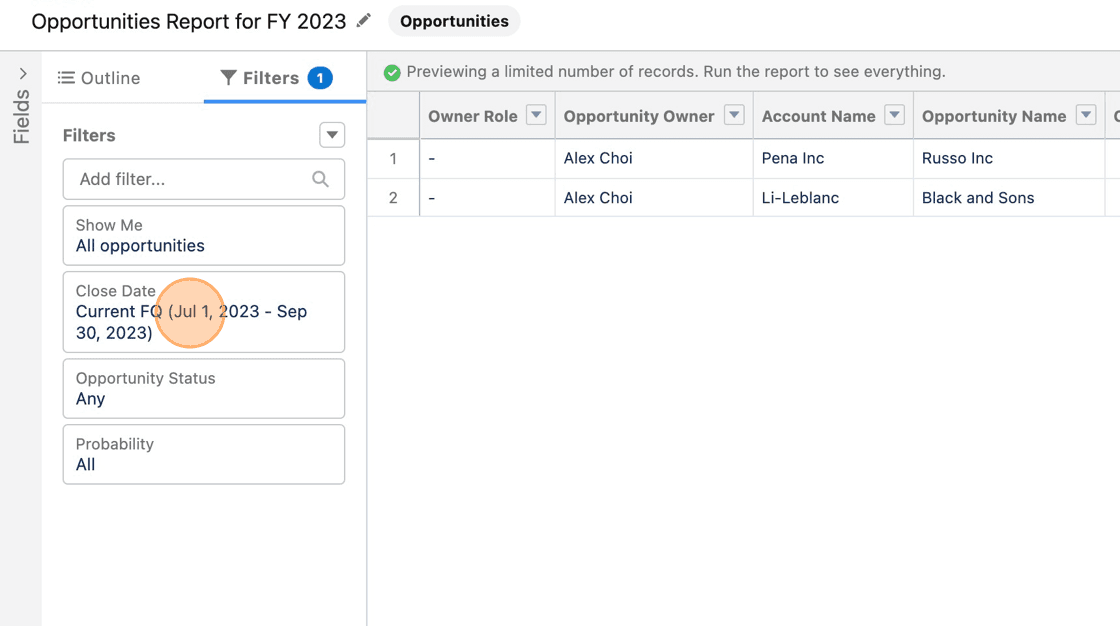
Filtering Data in Salesforce Reports
Use filters to narrow your report to exactly what you need. For example, filter only Open Opportunities, or Closed Won deals last quarter. Filter logic lets you combine multiple rules to create targeted reports.
Take It Further with Cross Filters and Row-Level Formulas
Once you're comfortable with basic filters, try using cross filters to include or exclude related records. For example, Opportunities without Activities. You can also add row-level formulas to calculate values directly in the report, such as profit margins or conversion rates. These advanced tools help make your reports even more dynamic and insightful.
Visualizing Data with Salesforce Charts
One of the most exciting features of Salesforce reporting is the ability to create charts and graphs with a click. Visual tools help identify trends, patterns, and outliers.
Just click Toggle Chart button to access chart options and visualize your data instantly.


Step-by-Step Tutorial: Build Your First Salesforce Report
This hands-on tutorial will walk you through:
Selecting the correct report type
Adding and filtering fields
Grouping and summarizing data
Toggling charts
Saving and sharing your report
It’s everything you need to get started with Salesforce reporting today.
Bonus Tip: Add Reports to Dashboards
After saving your report, take it one step further by adding it to a Salesforce Dashboard. Dashboards let you display multiple reports in a visual layout, which is perfect for presenting performance trends, KPIs, or team metrics at a glance.
Top 3 Reporting FAQs for Beginners
1. Why can’t my team members see my report?
Salesforce sharing settings are based on folders. If a report is saved in a private folder, even if shared, others may not be able to view it. Always save your reports to the correct shared folder.
2. I can’t see certain fields?
Your user permissions limit visibility. If a field or object is restricted, it won’t show up in your report either. Check with your Salesforce Admin to adjust permissions if needed.
3. I have to make the same report every week. Can I automate this?
Yes! Create a dynamic report by setting the date filter to values like "Last Week" or "This Month." Then, save it and reuse it without changes.
Conclusion
Salesforce can be a complex platform, but its reporting and analytics tools are built to empower you, not overwhelm you. By analyzing your data effectively, you can boost efficiency, improve productivity, and gain deeper insights into performance.
Don’t be afraid to experiment and practice. You’ve done the hard work of collecting great data, so make the most of it with Salesforce reporting.
If you are ready to turn data into decisions, Techog can help you build reporting systems that support growth and clarity. Visit techog.ca to optimize your CRM and unlock the full power of your Salesforce investment.